Smart Grid
Greening of the U.S. Grid

Greening of the U.S. Grid

By: Akhila Golla†, Yuting Hu†, Vishnu Sai Teja Kondamudi†, Chandu Visweswariah‡, Sai Subhash Reddy Yarram†, Venkata Subrahmanyam Upputuri† and Jinjun Xiong†
†State University of New York, Buffalo
‡CURE100.org

According to the National Academy of Engineering, electrification and the electric grid constituted the top U.S. engineering achievement of the 20th century. But now it is already time to reinvent that same engineering marvel to run on 100% clean electricity. Did you know that 80% of U.S. electric customers are served by utilities that have set a 100% carbon reduction target? How are we doing so far on the greening of the U.S. grid? The short answer: mixed news.

Earlier this year, the Department of Energy published an updated Emissions and Generation Resource Integrated Database (eGRID), with details of nationwide electricity supplies in 2021. Combined with other data sources, this database gives us an intriguing snapshot of the U.S. electrical system and how it has evolved in the recent past.

This evolution has as its backdrop the urgent goal of decarbonization, which presents two challenges. First, the generation of electricity must move to 100% clean sources – solar, wind, hydro, bio and geothermal. Second, the capacity of the grid must dramatically increase to support electrification of mobility, building energy and industrial processes.

By crunching data and using geospatial images, this blog seeks to portray the progress of our grid against a net-zero goal and to frame the significant challenges ahead. The take-away from our analysis is that rapid progress is required in all aspects of renewable scale-out: permitting, interconnection to the grid, and transmission upgrades.

Load growth

The U.S. grid is divided into regions, with an Independent System Operator (ISO) responsible for grid stability and the operation of energy markets in each region. The graph below shows the evolution of electricity demand from 2010 to 2021, measured in terawatt-hours (TWhr) of electricity (one TWhr is one million kWhrs – our electric bills are typically expressed in kWhrs). Lines above the horizontal axis represent load growth and vice versa.

Each 4-letter code in the graph is an eGRID subregion, such as NYUP which is the upstate New York region. Since most people are unfamiliar with eGRID subregions, here is the same data by state.

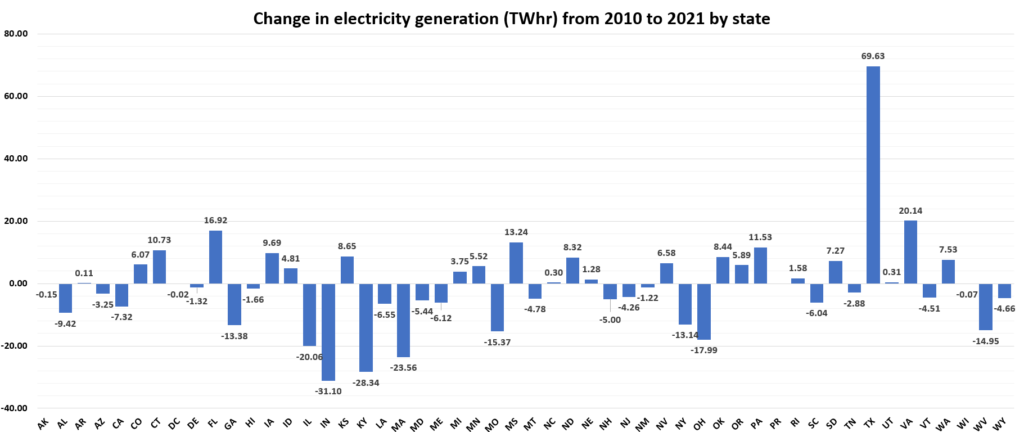
The total electricity consumption across the country increased by 1.5% during this period, but there’s a complex story behind this modest load growth. On the one hand, population increases and increasing electrification (e.g., heat pumps, electric vehicles) grew electric load. On the other hand, significant strides in efficiency (e.g., the transition from incandescent to compact fluorescent to LED bulbs, and energy-efficient appliances) depressed load growth. Putting these conflicting trends together, we see an aggregate growth of only 1.5%. Certain states like Texas show more significant growth due to population influx and possibly higher summer air conditioning load.

Looking ahead, however, a demand growth of almost 3x is expected by 2050 as we fully electrify mobility, building energy and industrial processes. This will require a massive build-out of solar and wind farms across the nation and off our coasts, with concomitant investments in transmission, energy storage and smart grids.

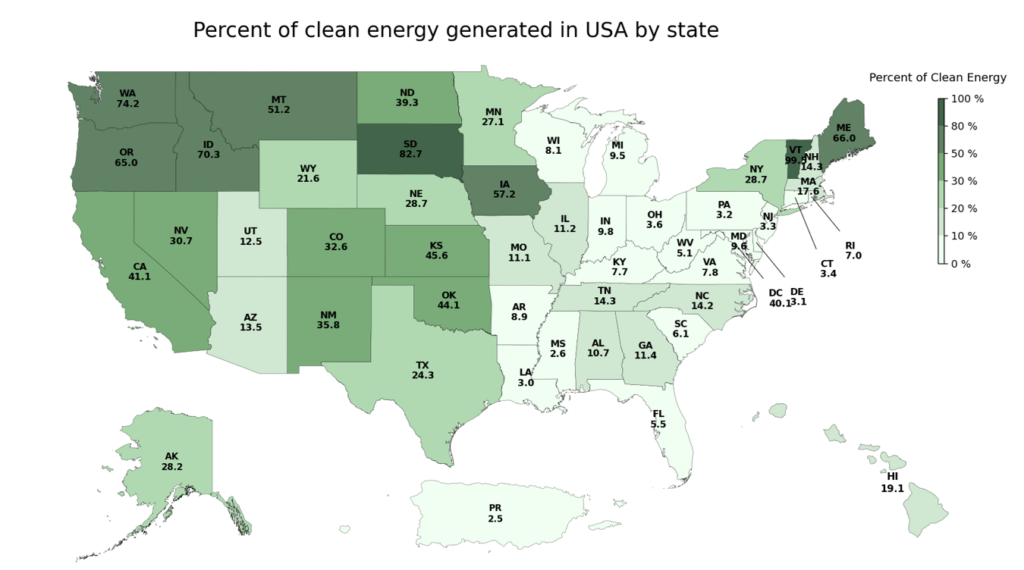
Fuel sources for electricity generation

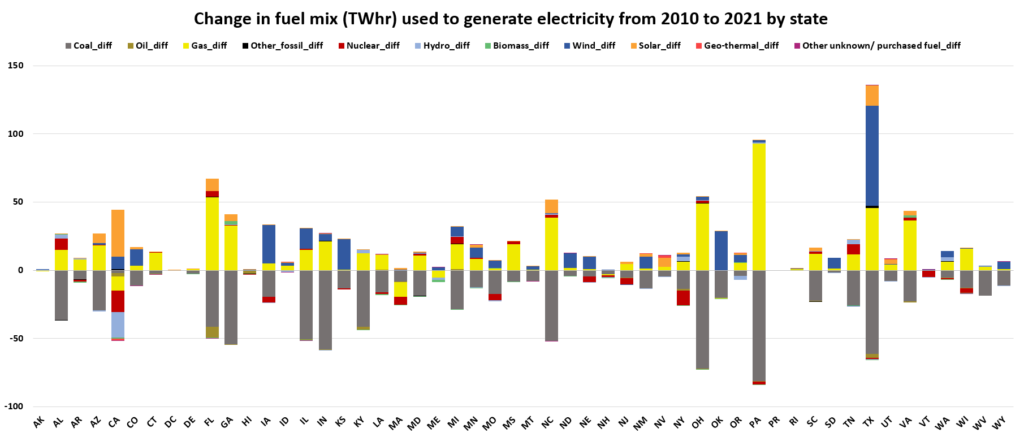
While we take reliable, on-demand electricity for granted in our day-to-day lives, many of us don’t pause to think about where the electricity comes from. Traditionally, electricity is produced in “thermal plants” where fossil fuels such as coal, oil or fracked gas are burned to produce steam which runs a turbine. Nuclear power plants produce a diminishing fraction of our electricity. There is now consensus that we must phase out fossil fuels and transition to clean sources such as wind, solar, hydroelectric, biomass and geothermal. While these new “fuel sources” provide environmental and health benefits, they increase the challenge of maintaining and operating a grid with intermittent energy sources since the wind doesn’t blow all the time and the sun certainly doesn’t shine all the time.

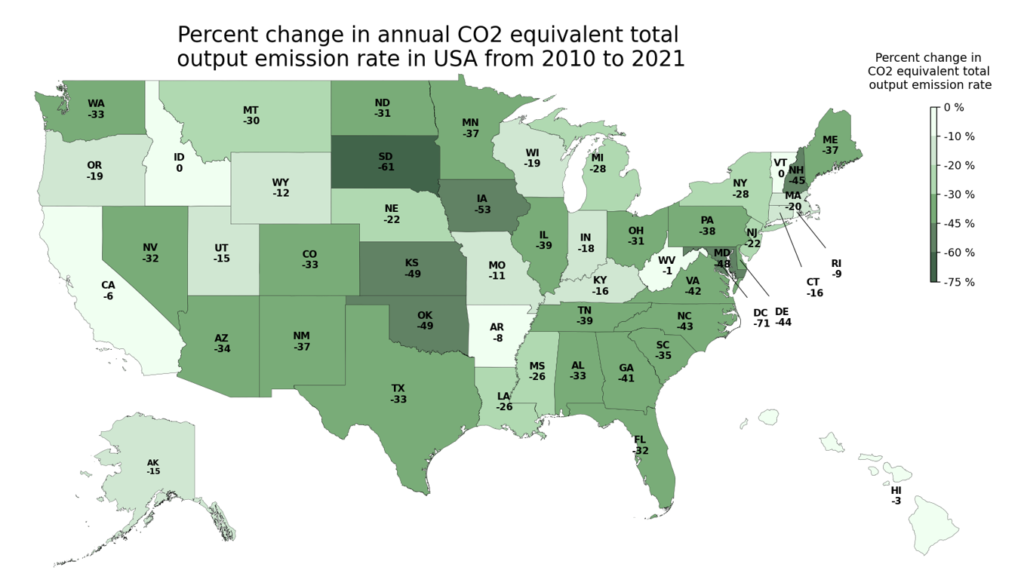
The image below illustrates the change in the fuel mix for electricity generation by state from 2010 to 2021.

The most striking features of the graph are the grey and yellow bars, representing the phase-out of coal plants (grey bars below the horizontal axis) and their replacement, by-and-large, with fracked gas plants (yellow bars above the axis). Unfortunately, despite fracked gas producing 1/3 as much CO2 emissions as coal, this does not represent climate progress. Fracked gas is 90% methane, which is a very potent greenhouse gas. When released unburned into the atmosphere, molecule-for-molecule, it causes 81.2 times as much trapped heat compared to CO2 over a 20-year period. Since 2.5% to 3% of all fracked gas leaks (at the well head, at the compressor station, in transmission and distribution pipes and at its final destination), the clean-burning nature of fracked gas is more than nullified by fugitive emissions. Thus, the shift from coal to gas is not climate stability progress, albeit some may claim it is progress for air quality with concomitant health benefits. In fact, courtesy of Our World in Data, by re-calculating their statistics using 20-year Global Warming Potential (GWP) indices instead of 100-year GWPs, 25% of the U.S.’s annual greenhouse gas emissions are due to methane, 2/3 of which is due to fugitive emissions!

By peering at the graph carefully, we see progress in the ramp-up of on-shore wind (particularly in Texas, Wyoming, Oklahoma, Nebraska, North Dakota and Iowa) and solar (particularly in California, Texas and Florida). As a result, in the period 2010 to 2021, there has been a significant but non-uniform increase in the percentage of clean energy nationwide, as shown in the map below.

The good news is that most of the country has made significant progress with states like Vermont and Iowa leading the way. However, it’s worth noting that three specific states namely Idaho, Louisiana and Mississippi have not participated in the nationwide emissions reduction in the 2010 to 2021 period.

Looking ahead, the journey to 100% clean electricity will not be easy in any part of the country but will be particularly challenging in some states.

Next, let’s look at the percentage of clean electricity (i.e., wind, solar, hydro, bio, geothermal) in each state based on 2021 generation statistics.

We can see that some states are close to 50% or higher of clean electricity (Vermont, South Dakota, Washington, Idaho, Maine, Oregon, Iowa, Montana) and 20 out of 52 U.S. states generate over 25% of their electricity from clean sources. However, the laggards are Ohio, Connecticut, New Jersey, Pennsylvania, Delaware, Louisiana, Puerto Rico and Mississippi, which generate less than 5% of their electricity from clean energy resources.

Cost of electricity

Electricity costs across the nation

Before we examine greenhouse gas emissions, let’s take a look at trends in the cost of electricity. For all those struggling with utility bills, it is true that electricity rates have been steadily climbing. The surge in electricity costs can be attributed to various factors, including inflation, rising fossil fuel prices, the operational challenges faced by our energy grids and regional nuclear power plant closures.

The map below shows average electricity rates, measured in ‘cents per kilowatt-hour.’ For this section, we have drawn data from the Energy Information Administration and Inside Climate News.

Electricity rates are high on the East and West coasts and in Alaska and in Hawaii, low in parts of the country with abundant hydro resources (Northwest, upstate New York) and moderate in the rest.

The map below shows the change in electricity rates from 2015 to 2022. For reference, inflation during that same period was 8%.

These higher-than-inflation rate increases do not bode well for solving the climate crisis. The need of the hour is abundant, clean, inexpensive electricity so that we can electrify all our loads and thus achieve economy-wide decarbonization. Fighting economics is like rolling a boulder uphill, but the next section explores how economics is finally on our side!

Cost reducuction trends in electricity

Wind, solar and batteries have exhibited dramatic year-over-year cost reductions from innovations, mass manufacturing and a rapid “learning rate” (defined as the reduction in cost for each doubling of production volume).

The three figures above show (on a logarithmic scale) these cost reductions. As a result, the cheapest way to generate electricity almost anywhere in the world is with wind turbines and solar panels, as shown in the graphic below, courtesy of Lazard and the New York Times.

These trends are great news for the environment, for our health and for our wallets. Combined with generous subsidies at the Federal and State level, a golden period of renewable expansion is nigh, and will carry us to our net-zero targets. Speaking of which, exactly how much decarbonization has been achieved and what is the remaining carbon content of electricity in each state?

Greening of the grid

Between 2010 and 2021, in almost every region across the country, carbon emissions have been on a steady decline as shown in the map below.

The map vividly portrays significant progress across most of the country. As can be seen from the map, several traditionally “deep red” states in terms of political leanings are “deep green” when it comes to emissions reduction from electricity generation! Note that two very green states, Idaho and Vermont, had small increases in the carbon content of electricity (due, for example, to the retirement of the Vermont Yankee nuclear plant) and have been marked as zero in the map.

The challenge ahead

We mentioned early in the blog that 80% of U.S. electric customers are served by utilities that have set a 100% carbon reduction target As shown in the map below, many of the most populous states in the nation have a 100% carbon-free goal by 2050 or sooner. Sixteen states plus Washington, DC and Puerto Rico require a transition to 100% renewable electricity, with orders variously worded as “legislation,” “goals,” “requirements” and “targets set by executive orders.”

Let’s take a closer look at how much carbon emission, measured in pounds per MWhr of electricity generation, is currently being released in each state. Ultimately, our challenge is to drive this to zero.

As we look at the above map, we see 850 lbs or less per MWhr in many states on either coast, and relatively moderate numbers in the South. However, there’s a “middle swath” with alarmingly high carbon numbers. The path ahead is pretty clear: rapid adoption of solar in sunnier climes, expansion of offshore wind off both coasts, maximum tapping into hydroelectric resources where geographically available and onshore wind expansion across the board, particularly in the middle belt where wind is steady and plentiful.

Conclusion

From 2010 to 2021, we see modest progress in terms of greening of the grid. The replacement of coal by gas is not necessarily forward progress from a purely greenhouse gas point of view, due to methane leakage. We also see increases in electricity costs, which do not bode well for future decarbonization or economic growth. The solution to all these problems is a rapid scale-out of renewables across the nation. Luckily, those technologies can deliver abundant electricity at the lowest cost among all fuel sources. There are also well-reasoned subsidies in place like the Production Tax Credit (PTC) and Investment Tax Credit (ITC) spurring these private investments.

As we strive for a future powered by abundant 100% clean energy, we need to pay attention to three challenges which threaten to derail progress.

  1. We need our system operators to streamline applications for interconnection to the grid from solar and wind developers and the requisite reliability analyses. The interconnection queues are far too long and delay projects inordinately. For example, the New York Independent System Operator announced at the recent Alliance for Clean Energy-New York (ACE-NY) conference that it has over 500 renewable energy projects in its interconnection queue.
  2. We need a much faster permitting process. In cases where trees need to be cut down to make way for a solar or wind farm, a carbon assessment should be the primary determining factor. Sight lines, drainage issues and ecosystems must be relegated to secondary considerations due to the urgency of the climate crisis we face. Local conservation councils need education to come around to this point of view.
  3. We need investment in transmission upgrades so that we can get the wind and solar energy produced in remote areas to the urban areas where they are more required.

These critical steps will enable both greening of the grid, and expansion of capacity that is required for us to make climate progress.

Close Bitnami banner
Bitnami