Electric Schoolbus
Impact of Electromobility on PM2.5 Across the United States
Chandu Visweswariah
0
By: Subbu Upputuri, Dr. Chandu Visweswariah, Dr. Thomas N. Theis, Dr. Anjali Sauthoff
The transition from fossil fuel vehicles to electric alternatives is a critical step towards reducing greenhouse gas (GHG) emissions and combating climate change. However, the localized impacts on air quality, specifically fine particulate matter (PM2.5) emissions, are more nuanced. In some electricity zones of the country, significant progress in “greening the grid” is required before electrification of transportation can reduce both GHGs and PM2.5. In a previous blog, we laid the foundation for our methodology and showed sample calculations in the New York City and Westchester County zone (NYCW); here, we extend the study to the entire country.
We leveraged the Emissions and Generation Resource Integrated Database (eGRID), which provides comprehensive information on the environmental characteristics of electric power generation across each eGRID zone in the United States. We studied four cases: gas cars, diesel cars, gas school buses and diesel school buses. By analyzing the emissions data, we calculated the additional greening of the grid required in each eGRID zone to ensure that electrification improves both GHGs and PM2.5.
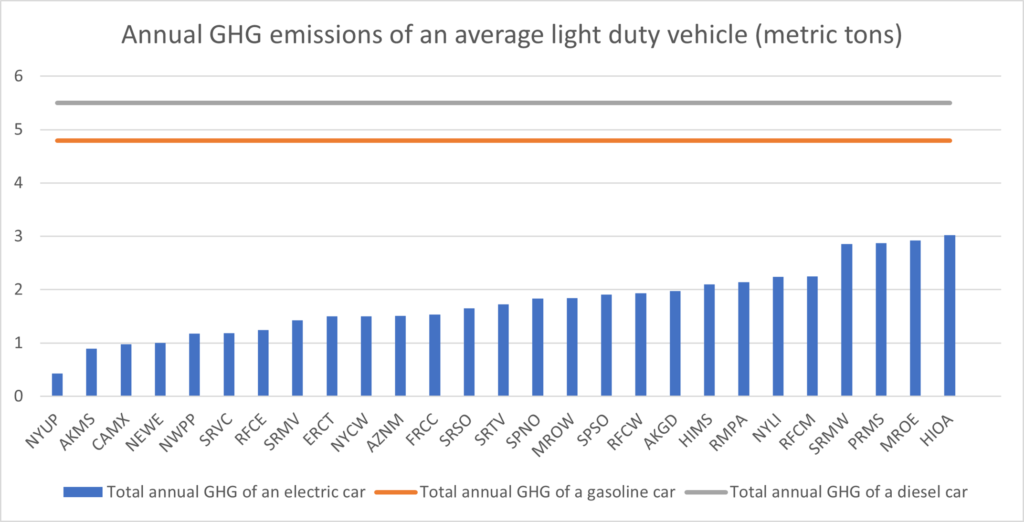
Figure 1 shows the GHG emissions for a light-duty gasoline car, diesel car and electric vehicle driven 13,500 miles annually in each of the eGRID zones of the country. For fossil fuel vehicles, we include tailpipe emissions, whereas for electric vehicles we calculate the emissions from generating the necessary electricity for charging. Appendix A lists the zones and their acronyms, while Appendix B lists the assumptions used in the computation. Since emissions for fossil fuel vehicles don’t have a geographical dependence, they are plotted as horizontal reference lines across all zones.
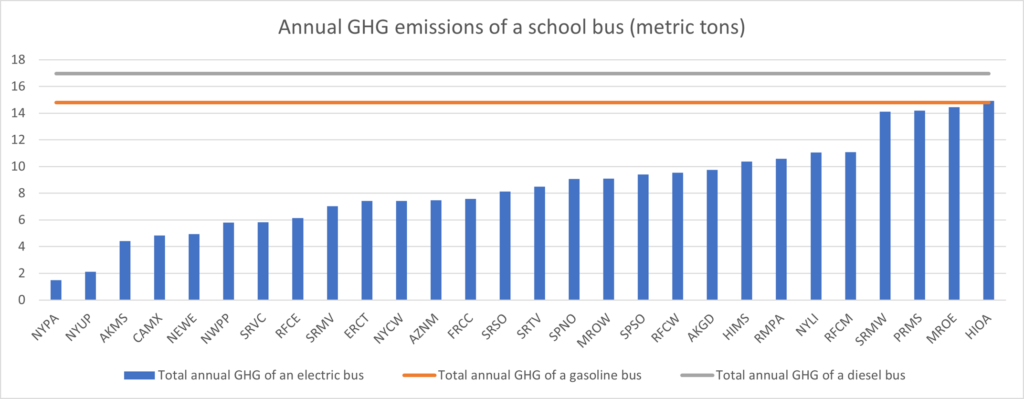
Figure 2 shows the GHG emissions for a large diesel, gas and electric school bus driven 10,000 miles annually in each of the eGRID zones of the country.
Thus, we reach a satisfying conclusion that electrification helps reduce GHGs across the nation and across different vehicle types and fuel choices. A special case is the first blue bar in Figure 2 labeled “NYPA” which stands for New York Power Authority. NYPA is a utility in New York that supplies public facilities (like public schools and municipal buildings) with electricity that is over 80% clean, which makes the GHG gains particularly impressive.
PM2.5 implies particulate matter emissions that are 2.5 microns or less in diameter. These are easily inhaled and lodge in human lungs, exacerbating asthma, emphysema, and other respiratory ailments, contributing to adverse birth outcomes, and even increasing the risk of certain types of cancer. For fossil fuel vehicles, the contributing factors are tailpipe emissions, tire wear and brake wear. For electric vehicles, PM2.5 is constituted by electricity generation, tire wear and brake wear.
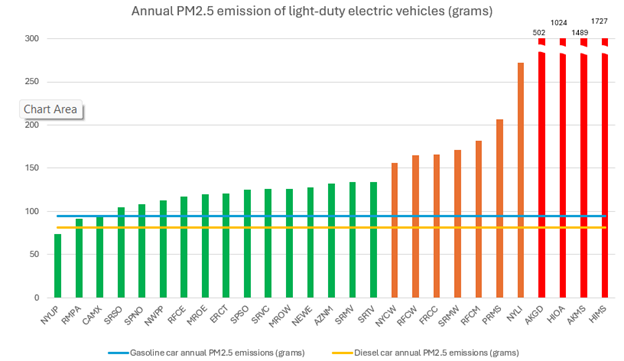
Figure 3 shows PM2.5 emissions for a gas car, a diesel car and a light-duty electric vehicle driven 13,500 miles annually in each of the eGRID zones of the country.
In the case of light-duty vehicles, electric cars are worse than diesel cars in all but one zone, and worse than gas in all but three zones of the country! The four red bars on the far right of the graph have been truncated so as to scale the chart for readability; their very high PM2.5 values are shown textually. We observe that in the green-colored zones, PM2.5 emissions are roughly break-even due to electrification. In the orange zones there is a 50 to 150% increase in PM2.5 emissions from electrification. And in the red zones of Alaska (AKGD and AKMS) and Hawaii (HIOA and HIMS), there is a 5x or greater increase in PM2.5. In these regions, a higher percentage of electricity is generated from diesel oil and a lower percentage from natural gas compared to zones in the contiguous United States. For the same electrical energy output, burning oil generates higher PM2.5 emissions than burning natural gas.
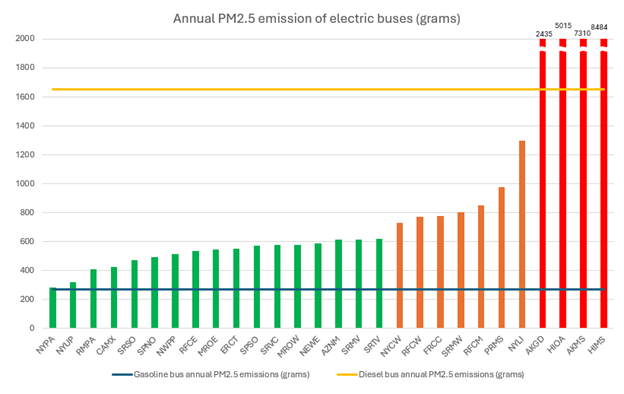
Figure 4 shows PM2.5 emissions for a large gas, diesel and electric school bus driven 10,000 miles annually in each of the eGRID zones of the country. The bars are color-coded as in Figure 3.
With the exception of Hawaii and Alaska, electric school buses perform better than their diesel counterparts despite the emissions from electricity necessary for charging. However, gas buses do better in every zone of the country.
Does this mean we should have pause in electrifying school buses? No. Rather, this finding tells us that “greening of the grid” needs to make further progress before electrification of transportation can be declared to be an environmental win-win. Just how much progress is required is studied in the next section.
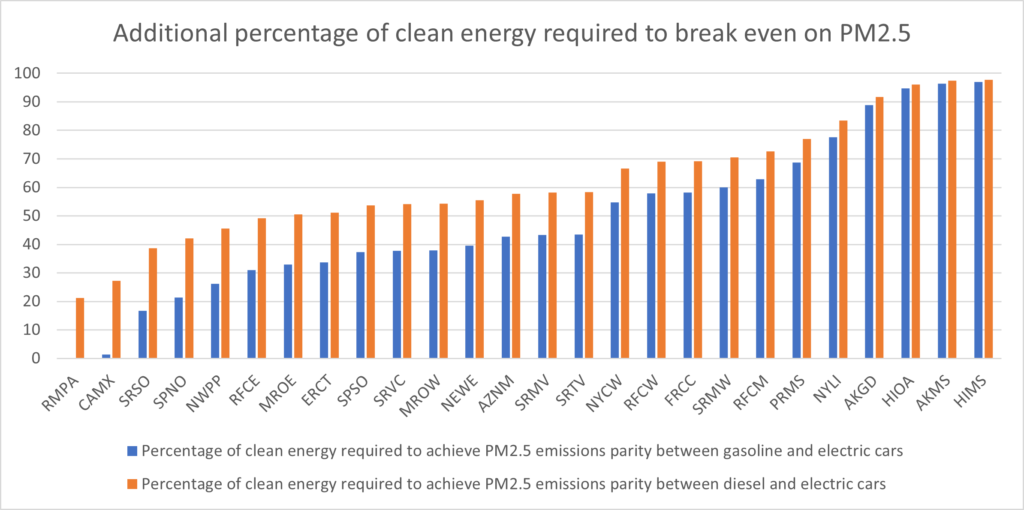
For each eGRID zone of the country, we computed the percent of additional “greening” (i.e., how much cleaner of an energy mix) is required in the mix of fuels used to generate electricity so that a gas or diesel vehicle would break even on PM2.5.
For light duty vehicles, the results are presented in Figure 5. For example, the first 20% orange bar for RMPA (Rocky Mountain Power Area) means that electricity would have to get 20% cleaner in that zone before a diesel car and electric equivalent emitted the same PM2.5, whereas the absence of a blue bar implies that converting from gasoline to an electric vehicle is already beneficial in regard to PM2.5.
To be competitive with diesel cars on PM2.5, almost every eGRID zone must achieve a 50% or more “clean up” of its electricity generation compared to today’s fuel mix.
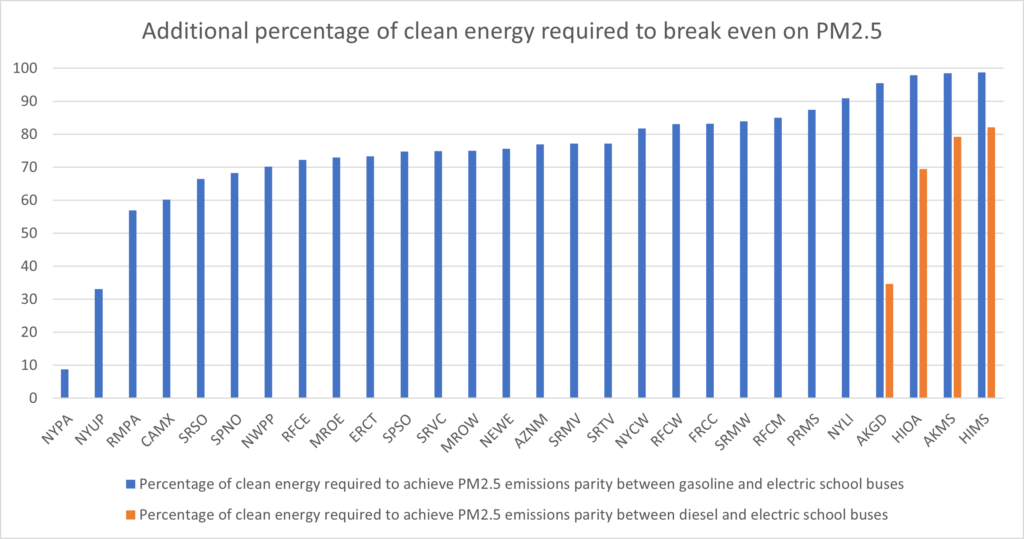
Similarly, we computed results for large school buses. The results are presented in Figure 6.
Comparing first to diesel buses, across a majority of zones, PM2.5 is reduced by electrification of school buses (the absence of an orange bar indicates that an electric school bus outperforms a diesel bus in that zone). This finding highlights the substantial air quality benefits that can be realized by electrifying high-emitting diesel bus fleets, even in regions with a relatively modest contribution of renewables or clean energy sources in their electricity generation portfolios. The four regions in Alaska and Hawaii are the only zones where electrification leads to an increase of PM2.5 over a diesel bus – everywhere else, converting from diesel to electric is a clear win-win.
Comparing next to gasoline buses, every zone in the country requires additional greening, and in all but two New York zones, to the tune of 50% or more. Despite this finding, we advocate for rapid electrification of school buses and simultaneous improvement in the fraction of renewable electricity in the coming years.
In the above analysis, in order to simplify the calculation, we assumed that usage of each fossil fuel in the mix would be reduced by the same percentage. However, depending on fuel source and other technical considerations, some electrical generation systems pollute much more than others. Greening the most polluting systems first will reduce PM2.5 emissions more rapidly than indicated by the results above.
The findings reveal significant variations in clean energy requirements across eGRID zones and vehicle categories. While transportation electrification offers promising carbon emission reductions, its impacts on PM2.5 emissions and air quality are region-specific.
As the grid transitions towards cleaner energy sources, the air quality benefits of transportation electrification will become more pronounced across all regions and vehicle categories, and the gains will be “automatic” as the grid is cleaned up. So, it is not advisable at this time to invest in a gasoline or diesel vehicle that may be driven for 10 or more years.
Ultimately, a holistic strategy that addresses both transportation electrification and grid decarbonization is essential to achieve the “win-win-win” scenario of reduced costs, improved air quality, and mitigated climate impacts. Such a strategy would include aggressive electrification of transportation, build-out of charging infrastructure, acceleration of permitting and deployment of renewable energy sources, investment in transmission, and stringent emissions standards for power plants.
It is also crucial to consider the environmental justice implications of this transition. Electromobility shifts PM2.5 from the tailpipe in the locale where the vehicle is driven to a possibly remote power plant. Disadvantaged communities bear a disproportionate burden of air pollution from fossil power plants and industrial facilities. As transportation electrifies, there is a risk of further concentrating PM2.5 emissions in these vulnerable areas unless proactive measures are taken to clean up the energy supply chain.
Policymakers must engage with impacted communities in each zone, implement robust monitoring and enforcement mechanisms, and explore innovative solutions such as distributed renewable energy generation and energy storage in parallel with electromobility to mitigate potential environmental injustices.
The road to a sustainable transportation future is complex, requiring a nuanced, zone-specific approach that balances the global benefits of reducing greenhouse gas emissions with localized air quality impacts and environmental justice considerations. The data presented in this analysis underscores the need for tailored strategies that consider the unique clean energy requirements and PM2.5 implications of vehicle electrification in different regions. By prioritizing the most impactful vehicle classes and zones, accelerating the transition to clean energy sources, and addressing environmental justice concerns, we can maximize the benefits of transportation electrification while safeguarding public health and promoting equitable access to clean air across all communities. Given the urgency of the climate crisis, electrification of transportation should proceed full steam ahead, even if PM2.5 gains will only accrue in subsequent years.
|
AKGD |
Alaska Grid |
|
AKMS |
Alaska Maritime System |
|
AZNM |
Arizona-New Mexico |
|
CAMX |
California/Mexico |
|
ERCT |
Electric Reliability Council of Texas (ERCOT) |
|
FRCC |
Florida Reliability Coordinating Council |
|
HIMS |
Hawaii-Maui Islands |
|
HIOA |
Oahu (Hawaii) |
|
MROE |
Midwest Reliability Organization East |
|
MROW |
Midwest Reliability Organization West |
|
NEWE |
New England |
|
NWPP |
Northwest Power Pool |
|
NYCW |
New York City/Westchester |
|
NYLI |
New York Long Island |
|
NYPA |
New York Power Authority |
|
NYUP |
New York Upstate |
|
RFCE |
ReliabilityFirst Corporation East |
|
RFCM |
ReliabilityFirst Corporation Michigan |
|
RFCW |
ReliabilityFirst Corporation West |
|
RMPA |
Rocky Mountain Power Area |
|
SPNO |
Southwest Power Pool North |
|
SPSO |
Southwest Power Pool South |
|
SRMV |
SERC Reliability Corporation Mississippi Valley |
|
SRMW |
SERC Reliability Corporation Midwest |
|
SRSO |
SERC Reliability Corporation South |
|
SRTV |
SERC Reliability Corporation Tennessee Valley |
|
SRVC |
SERC Reliability Corporation Virginia/Carolina |
|
Assumption |
Gasoline Car |
Diesel Car |
Electric Car |
Gasoline Bus |
Diesel Bus |
Electric Bus |
Units |
|
CARBON |
|||||||
|
Average distance driven per year |
13,500 |
10,000 |
miles |
||||
|
Fuel efficiency |
25 |
N/A |
6 |
N/A |
mpg |
||
|
Fuel efficiency |
N/A |
3.333 |
N/A |
0.5 |
miles/kWh |
||
|
GHG per gallon |
0.00887 |
0.01018 |
N/A |
0.00887 |
0.01018 |
N/A |
metric tons |
|
PM2.5 EMISSIONS |
|||||||
|
Due to exhaust |
0.003 |
0.002 |
0.0 |
0.019 |
0.148 |
0.0 |
grams/mile |
|
Due to break wear |
0.001 |
0.001 |
0.0002 |
0.002 |
0.003 |
0.0008 |
grams/mile |
|
Due to tire wear |
0.003 |
0.003 |
0.003 |
0.006 |
0.014 |
0.016 |
grams/mile |